How do you add a dashboard page as a section in Freedom UI? I have an existing dashboard page which I want users to be able to access as though it were its own section, but I can't add the existing page to the workplace as it doesn't exist in the lookup window. I had a look at creating a new section in the application hub, but this will either create a new entity or have to be based over an existing entity, but this dashboard isn't based over any one particular entity and presumably doing this would create a new Section page which I didn't want. Any info on how to turn an existing page into a Section in Freedom UI?

Like 1

Like

4 comments
Best reply

Hi Pavlo, Essentially I want to create a standalone section page, so one that isn't tied to a specific entity or have to be created using the section template in the application hub.

Yes, using Freedom UI exclusively.

And the page I have created is inherited from the Homepage exactly. Is it possible to register this page as a section page?

Hi Harvey!

Please confirm, am I understanding correctly that you want to replace the section ListPage with your own page containing dashboards?

Is your dashboard page implemented in FreedomUI?

Which page does this page inherit from? Is it the Homepage?

Hi Pavlo, Essentially I want to create a standalone section page, so one that isn't tied to a specific entity or have to be created using the section template in the application hub.

Yes, using Freedom UI exclusively.

And the page I have created is inherited from the Homepage exactly. Is it possible to register this page as a section page?

Hi,


In general, there isn't a built-in feature for this. However, for such usage, we have the option to set a Homepage for the workplace. You can set this page instead of the current one.


But if you need two of your dashboard pages to be on the same workplace and displayed as a section, you can create a new section in the Freedom UI and replace its SectionSchemaUId with the UId of your dashboard page schema.


update "SysModule" set "SectionSchemaUId" = 'UId of dashboard schema module' where "Id" =  'Id of the section you want to open with the dashboard'


For example, I successfully set the SalesEnterpriseHomePage to open from the test section.


Hope this helps!

Thanks Pavlo, we already have a page being used as the Home page of the workplace the additional dashboard needs to reside in, so we had to do the database editing you suggested to get it to work, which it now does - thank you! This would be a very useful option to be able to do without custom SQL, no code being the aim of Creatio config going forward!

Show all comments

Hello everyone,

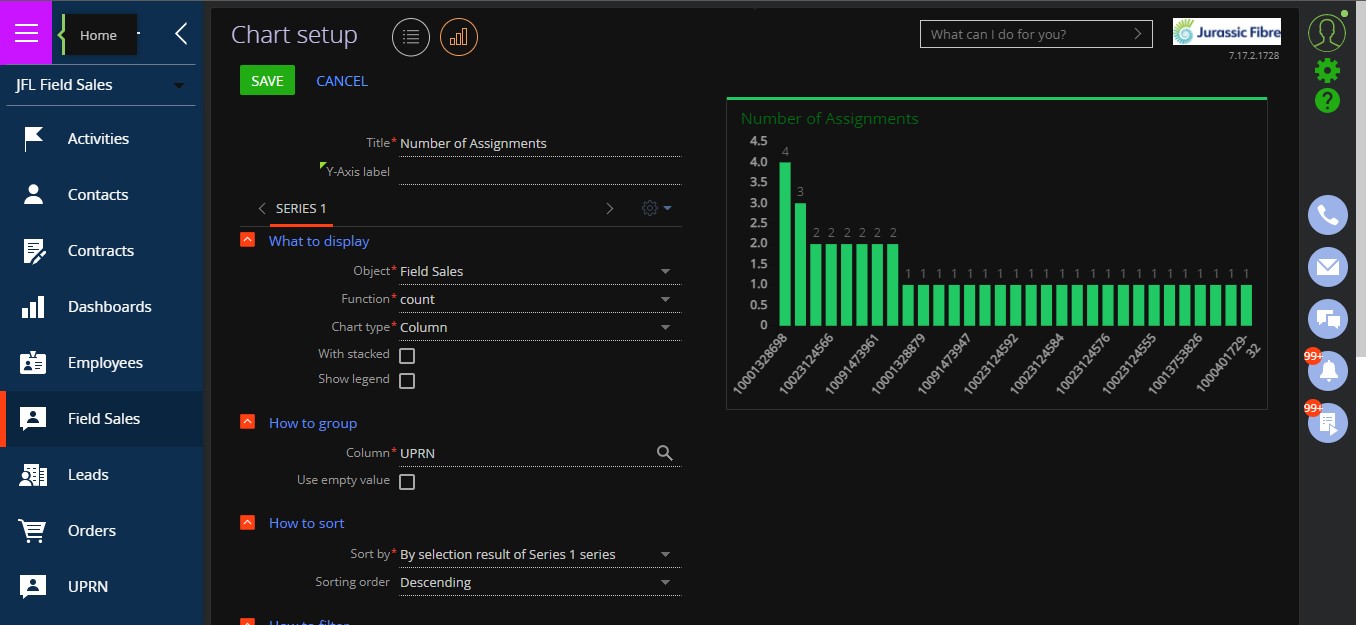
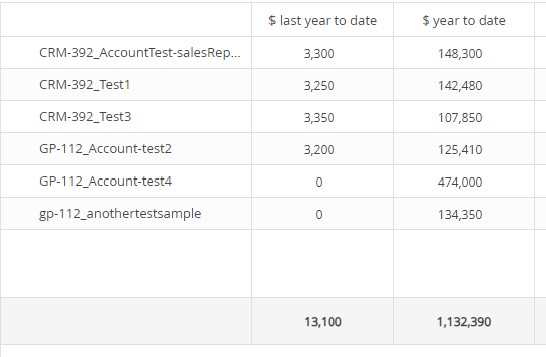
I would like to calculate sales KPI and show them in dashboard like Last year to date, year to date sales, calculate the year to date difference and also made it also in percentage.


First I tried with a list and used pivot table to calculate these KPIs but I encounter a case wich if an account made an order this year but not the previous year, an error : divide by 0 occurs. I can't use any operators in the formula to avoid this case.


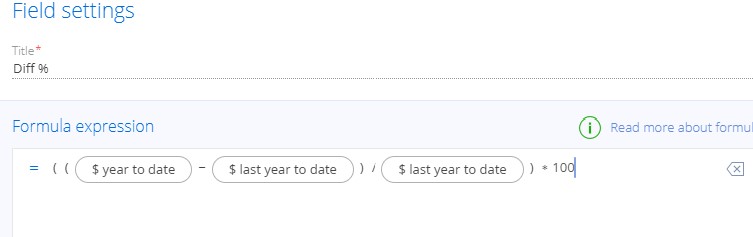
So I tried another solution by using the "calculated metrics" plugin to calculate the difference in sales since the beginning of the year and the difference in sales since the beginning of the last year as a percentage.

This works but the display is only in the form of metric values, is it possible to build a column dashboard with the metric data as input?


Can I create an object from my metric data and use it in a dashboard ?

Or even a function that takes order.account.owner as currentUser and returns the data?

Like 1

Like

1 comments

Hi,


Unfortunately, it is impossible to change the display of the dashboard from the Calculated metrics add-on using basic methods.


Regarding the "Divide by zero error encountered" error, to avoid this error, you can add +0.01 /(last year to date + 0.01) to the value by which the division is performed, but this will cause a slight difference in the calculations.


You can also add filtering to the Pivot table so that records with the value "last year to date" are not included in the list, so division by 0 will not occur and you will avoid the display error.


We have created a task for our development team to investigate and develop a mechanism to address this error in future versions of the application as the error occurs at the database level.


Thank you!

Show all comments

We're trying to create a chart to analyse Lead progression through the different Lead Stages, but the only sorting options are alphabetically by the grouping column or by the measure value. We want this to be sorted by an additional column on the Lead Stage that defines the order within the Lead progression rather than alphabetically or by the value to keep a consistent and logical order to the data, but cannot see an option for this unless there's a trick we're missing. Could someone please advise on how this might be done? We're mostly working with Freedom UI pages and therefore charts.

Like 2

Like

5 comments

Vladimir Sokolov,

it may be related, but that question is discussing combo boxes in pages, whereas I’m looking for chart sorting (e.g. in a bar graph) so I expect any solution would be fairly different.

Harvey Adcock,


Good day,


Could you please provide more details about your business task?


Perhaps you could take a screenshot with a description of your requirements so that we can better understand them and offer advice.


We are looking forward to your feedback.


Best regards,

Pavlo

Hi Pavlo,


Sure, what the business is asking for is to be able to sort a chart's columns by the lead stage through the process, rather than by the stage's name alphabetically or by the total number of leads in each stage as can be selected by default in the chart options. For example, see this chart available in the Home section of the Sales workplace in a clean CRM trial environment:


It is currently sorted by the stage name alphabetically, which doesn't align with the progression you actually get through the Opportunity stages. Looking at the sorting options, we can see that the only ones available are to sort by the grouping name alphabetically, or by the measure value:


So we are unable to sort by another field on the Lead Stage lookup that we've created - Stage Number - which would order it correctly. What we'd like is to be able to use that additional field for sorting without using it as the labels for the x axis.


If there are any workarounds for this besides numbering the stage names themselves, we'd love to hear about them!


Many thanks,

Harvey

Harvey Adcock,

Good day,


Unfortunately, it's not possible to implement this with the current basic functionality. However, we have registered the idea for our development team to consider implementing this feature.

Perhaps the "Full pipeline" dashboard type may work for you, where stages are grouped according to their placement in the DCM field?


Thank you for reaching out!

Show all comments

Hi all,


Is it possible to have "master filters" on dashboards with Freedom UI Designer ?


For example, to keep it simple, I create a dashboard with 3 KPIs in widgets such as : number of leads generated, number of opportunities generated, $ value of opportunities signed.


Then as a manager, I would like to be able to have a drop down list where I can select a sales rep, and the data in the dashboard widgets filter on the selected sales rep. Another use case, would be to have start / end dates to filter to choose from, that would filter the data shown in the 3 widgets.


(In the end, the same way we can filter data shown on list pages.)


This is the kind of feature offered by pretty much all the CRM competing brands OOTB but not Creatio (before Freedom UI) and is a big limitation for management.


However, I am not 100% familiar with the potential of Freedom UI.


Thank you for your contribution,


Damien

Like 0

Like

3 comments
Best reply

Hello Damien,


This feature was available in OOTB sections in Old UI:


Unfortunately, though - it is still not aviable in Freedom UI at the moment. Thank you for your question, it's aviability will be prioritised in our development roadmap.


Best Regards,

Dan


Hello Damien,


This feature was available in OOTB sections in Old UI:


Unfortunately, though - it is still not aviable in Freedom UI at the moment. Thank you for your question, it's aviability will be prioritised in our development roadmap.


Best Regards,

Dan


Denis Bidukha,


Hi Denis,


Thank you for you answer - it's great to know it exists on the "contextual" dashboards in Creatio - it would be great to also work OOTB in the Dashboards Section itself too :) !


Best day,


Damien

Hello Team


Has this request been taken up? We have had  many conversations on this with our customers and it is the most wanted feature for Management groups.


Thanks

Show all comments

Hello all!

I modified the leads dashboard to show an additional chart as can be seen in the left of the screenshot.

When logging in with my test user the newly created chart is invisible (right side).

The test user has of course default reading rights for the dashboard as he can see all the other charts.

What do I have to do to fix this?

Like 0

Like

3 comments

Hello Christian, 


Please write to support@creatio.com, as this issue needs more analysis and will require external access to your instance (from Supervisor and test user).


Thanks, 

Igor

Thanks, will do.

Support helped me out - solution is not perfect. Recreate all relevant dashboard in English and then they are visible in other languages too.

Show all comments

Hi it would be great to be able to group series by trimester.


For example if we want to compare signed opportunities by quarter, either we have to create 4 tables at the moment with filters on specific dates (need to rework the dashboard each year), or make due with visualization of 3 months. But we would like to group per quarter for the whole year and compare par current versus last year.


Also, in the visualization, could we have months in text and not numbers ?


(January, February, etc... instead of 1, 2, ...)


3 comments

Hello 


We have already registered the idea for our R&D team to implement this functionality in further releases. I will assign your case to this project in order to increase its priority.  


Thank you for helping us to improve our product. 


Best regards,

Bogdan

Ditto - we have the same need to be able to report quarterly results ie.  Sales Sold by Quarter by Sales Manager


Hi Team !


Do you have any idea on planned availability ? :)


Cheers,


Damien

Show all comments

Hi community,

is it possible to move a dashboard to another section?

eg. a dashboard is created in the account section, but should be moved or copied to the dashboard section


Like 1

Like

1 comments

Hello Jasmin,


You'll need Data elements to your package for either SysDashboard or SysWidgetDashboard:

  1. SysDashboard - Stores the dashboards in the Dashboards section or in the Analytics part of a Section
  2. SysWidgetDashboard - Stores the dashboards on pages - for example if you've added dashboard widgets on a page

If your dashboard is just a normal dashboard, bind data to your package from SysDashboard where the Title is the title of your dashboard. If these are dashboard widgets added to a page, look for the modules part of the page code and make note of the recordId values for the dashboard widgets there. Bind the records from SysWidgetDashboard with those Id values to your package. 

Note, this doesn't apply to the newer Homepage dashboard views.

Ryan

Show all comments

Hello Community

I'm currently trying to set up a list dashboard, whose information is only displayed to the

user who is currently logged in with his account.

I think I have seen this in other dashboards. Is there also this possibility when setting up a list?

Thanks and greetings

Like 0

Like

0 comments
Show all comments

Dear,

Is it possible to have two dashboard-type sections ?

Thank you !

Nicolas

Like 0

Like

4 comments

Dear Nicolas, 


Unfortunately, there are no OOB tools to create a new section like this. 

It can be done only be means of advanced development and we do not have any examples of such sections created. 


We will register an idea for our R&D team to consider the possibility of adding the functionality which would allow to create sections like this with system tools in future. 


Kind regards, 

Roman


Do you have too many tabs? ;)

Julius,

yes that'it !

women's dashboard management

we have two companies and we would like to split the data. one solution might be to use the Creatio homepage which also allows now to create statistics widgets


Hi Roman Brown, Any update on creating two dashboards?


Show all comments

Hello,


I am trying to get the count of records that are only appearing more than once in a section. I have made the chart dashboard for this but, it is showing single values also which I do not want to be shown. I have attached the dashboard setting page below.


In this, the chart is also showing single count values which needs to be hidden. I have searched for a filter condition but could not find anything.


Hoping for an early response. 

Like 0

Like

3 comments
Best reply

malay garg,

You need to go to the higher object in the hierarchy to check this connection. The resulting filter depends on where those records appear. In the system, you will be able to check the number of records in a specific section/record, like the number of contacts in one account. 


Best regards,

Angela

Dear Malay,


Try adding the "Count" filter to the dashboard to show only values that appear more than once. 


Best regards,

Angela

I have already tried this, but function 'count' is not available in any condition. I have attached the screenshots of the filters at both places.


malay garg,

You need to go to the higher object in the hierarchy to check this connection. The resulting filter depends on where those records appear. In the system, you will be able to check the number of records in a specific section/record, like the number of contacts in one account. 


Best regards,

Angela

Show all comments